Wednesday, November 11, 2015

Assumptions Underlying the Pearson Product Moment Correlation Coefficient....

Assumptions Underlying the PPMCC: PPMCC is appropriate when three conditions exists: underlying measurement scales for the variables being correlated must be interval or ratio level, Scores for each variable should be normally distributed (no skewness should be there), relationship between the two variables should be fundamentally linear.

1.     The underlying measurement scales for the variables being correlated must be interval or ratio level (i.e., they are continuous).
Examples of variables that meet this criterion include revision time (measured in hours), intelligence (measured using IQ score), exam performance (measured from 0 to 100), weight (measured in kg), and so forth.
2.     Bivariate Normality (Bivariate normal distribution): Scores for each variable should be normally distributed. No skewness, neither positive nor negative should be there.
3.     Relationship between the two variables should be fundamentally linear.
4.     There should be no significant outliers (single data points within the data that do not follow the usual pattern).
5.     Homoscedasticity: It means variance around regression line should be same for all values of predictor variable (X). A relation is called heteroscedastic when all the points very (bunched up) near the regression line. Homoscedasticity is violated when there is much more variability (points are scattered away from the regression line) around the regression line. 

Serious violations in homoscedasticity (assuming a distribution of data is homoscedastic when in actuality it is heteroscedastic) result in underemphasizing the Pearson coefficient.  Assuming homoscedasticity assumes that variance is fixed throughout a distribution.

Heteroscedasticity is caused by non-normality of one of the variables, an indirect relationship between variables, or to the effect of a data transformation.  Heteroscedasticity is not fatal to an analysis, the analysis is weakened, not invalidated.  Homoscedasticity is detected with scatterplots and is rectified through transformation.

These notes are written by S C Joshi during EPSY 635 Course, Fall 2015, Texas A&M University. Acknowledgements to Dr. Bob Hall, Professor, EPSY, Texas A&M University for his assistance in understanding these terms during the course

Pearson Product Moment Correlation Coefficient....

PPMCC (only describes linear relation between two continuous (interval / ratio scale) variables):
[Correlation coefficient (rxy) is a statistic]

The correlation coefficient (rxy) is a measure of the strength of association between two continuous (interval / ratio scale) variables.  It reflects how closely scores on two continuous variables go together.  The more closely two variables go together, the stronger the association between them and the more extreme the correlation coefficient.
Mathematically, PPMRC (rxy) is defined as the ratio of the covariance of two continuous variables and the product of their standard deviations. It measures the strength of the linear relationship between normally distributed variables. When the variables are not normally distributed or the relationship between the variables is not linear, it may not be the appropriate method (Spearman rank correlation method would be more appropriate).

rxy = Covxy / SxSy = (Sum of products of errors/n-1) / SxSy 
Sum of product of rank orders is divided by n – 1 to standardize two variables against variability (it is equalizing the contribution of both). 

Important points about PPMCC:
1.     rxy is a scaled (normalized) measure of the covariance.
2.     It shows correspondence between the rank orders and is used to establish validity and reliability of the instrument. rxy is high means the rank orders of the two variables are close to each other and vice versa (disruption in rank means low r).
3.     Covariance (Covxy variance of both variables together) is different than that of coefficient of determination (r2proportion of variance in Y that can be accounted for by knowing X).
4.     rxy gives combined rank of two variables (interval / ratio scale), actually compares rank orders of two variables.
5.     Correlation coefficient (rxy) indicates magnitude (0 to 1) or intensity and direction (negative and positive). If the data points fall in a random pattern, the correlation is equal to zero.
6.     Outcome variable is called the response or dependent variable (Y) and risk factors and confounder are called the predictors, or explanatory or independent variables (X).
7.     It does not make any difference which variable is plotted in which axis as far as no prediction to be made. But if a prediction to be made then, by convention, predictive variables are plotted in the x-axis and outcome variables in the y-axis.
8.     X and Y variables can be measured entirely on different scales. Change in scale does not hamper the correlation because PPMCC does not depends upon scales (rxy does not have any unit in its own, it is a ratio).
9.     Pearson correlation coefficient, r, does not represent the slope of the line of best fit, it only shows the direction of the relationship, uphill or downhill.
10.                         rxy has nothing to do with the mean differences. Same means of two data scores does not tell anything about the relationship (rxy). 
11.                         rxy = ryx (Scatterplot will be same, but slope ‘b’ will change)
12.                         Every correlation (rxy) has two slopes and two intercepts (when Y as a function of X and when X as a function of Y).
13.                         A correlation of 0 does not mean zero relationship between two variables; rather, it means zero linear relationship. (It is possible for two variables to have zero linear relationship and a strong curvilinear relationship at the same time.)
14.                         Correlation does not imply causation: Two variables may be related to each other, but this doesn’t mean that one variable causes the other.
15.                         Because the two variables are paired through a linear equation (for them to show a linear correlationship) which is a logical relation between X and Y.
16.                         Larger sample size makes the correlation more stable. Large sample size is a pretty good reason to trust on the correlation. Small sample size does not provide accurate picture of the correlation, I mean a single outlier makes a huge difference in the correlation.
17.                         Correlation can be understood by various means: Scatterplots, slope of the regression line, variance interpretation (The squared correlation coefficient (r2) is the proportion of variance in Y that can be accounted for by knowing X. Conversely, it is the proportion of variance in X that can be accounted for by knowing Y).
18.                         The correlation coefficient is the slope (b) of the regression line when both the X and Y variables have been converted to z-scores. The larger the size of the correlation coefficient, the steeper the slope.
19.                         Linear relationship is described by for every one-point increase in one variable, you get a four-point increase in the other variable.
20.                         A PPMCC is appropriate to describe when X increases, Y decreases by the same amount.
21.                         Pearson Product Moment Correlation can be used to express the degree of relationship for:
1.     For every extra year of growth in a pine forest, you can expect an increase of 10,000 board feet,
2.     Strenuous exercise results in large weight loss, moderate exercise maintains weight at current levels and no exercise produces gains in weight.
22.                         The higher the correlation between X and Y, then more accurate the resulting predictions are.
23.                         We can have strong relationship between two variables bust still have a low correlation coefficient when: Relationship is non-linear and the variances are truncated (cut off)
24.                         We can’t say that correlation coefficient is not proper for those data where r = 0 as we really don’t know about that.
25.                         Potential problems with Pearson correlation: The PPMC is not able to tell the difference between dependent and independent variables. For example, if we are trying to find the correlation between a high calorie diet and diabetes, we might find a high correlation of .8. However, we could also work out the correlation coefficient with the variables switched around. In other words, we could say that diabetes causes a high calorie diet. That obviously makes no sense. 

Guilford’s Interpretation:
< 0.20 – Slight, almost negligible relationship
0.20 – 0.40 – Low (weak) correlation, definite but small relationship
0.40 – 0.70 – moderate correlation, substantial relationship
0.70 – 1.00 – very high (strong) correlation, very dependable relationship (their rank orders might be close to each other, scores with one variable grows with the other)

These notes are written by S C Joshi during EPSY 635 Course, Fall 2015, Texas A&M University. Acknowledgements to Dr. Bob Hall, Professor, EPSY, Texas A&M University for his assistance in understanding these terms during the course  

Sunday, October 11, 2015

Educational Technologies Transforming Teaching - Learning

This article talks about how Emerging Technologies in Education transforming teaching - learning at grass root level. Here are the results of a case study of designing and implementing a pilot program called '21st Century ICT Leadership Program' in a high school in Delhi, India in 2014. A group of forty high school students were selected to participate in a year long program. The analysis focuses their ICT competencies at different levels through performance at various self - organized events in the school. They have been outstanding throughout the program and deserve a special complement for their enthusiasm. I thank them from the core of my heart for making me learn through their unlearning  throughout our association.  

Saturday, October 10, 2015

Measurement scales & Central Tendencies

This concentration shows which central tendency is most appropriate for which particular measurement scales

By S C Joshi during EPSY 635 Course, Fall 2015, Texas A&M University
Acknowledgements to Dr. Bob Hall, Professor, EPSY, Texas A&M University 

Monday, August 31, 2015

The New Name tag ......with the new hopes and new possibilities in life.....

Howdy (Official greeting of Texas A&M University)!

It's completely a new beginning as a graduate student here at Texas A&M University (TAMU) as I have started my degree with learning sciences in Educational Psychology at TAMU. This is a different experience than that I had in the past, I mean, quitting the job, particularly at the this juncture life, and getting into the student life once again :).

This semester (Fall 2015), I am enrolled for three courses (core courses; EPSY 622 - Measurement and Evaluation in Education, EPSY 635 - Educational Statistics, and EDTC - 645 Emerging Technologies for Learning-I). 

Bit excitement, lots of worries. Overall, it's a mixed experience. After serving as a teacher for almost 18 years, it's nice to be a student. 

TAMU is a great place for learning (and for living too). It's a place of 'happenings.' It has a nice culture of adopting variety of learners joining TAMU every semester. 

I am humbled, and would like to spread a word of thanks and gratitude to all those who have been little or huge means, some way or the other, to my learning journey. I am looking forward to get plentiful such people in my way forward.

With that said, I take this opportunity to express my deepest gratitude to Ahlcon International School and my Principal there (June 01' 2006 - August 07' 2015), Mr. Ashok K Pandey, without whose motivation and guidance I wouldn’t have even thought of pursuing my professional career as a researcher.


It is my radiant sentiment to place on record my best regards, and my deepest sense of gratitude to my 
wife Kalpana Joshi, for her contribution in providing conducive environment at home, and making me free from all my household responsibilities time to time, furthermore, to my daughter Kaatyayani Joshi, whose countless days and hours I have stolen during the course of preparation to get into this program. I love my newly born son Aditya Joshi (9 months) very much and I enjoy his activities through Skype. But I get worried when he doesn't recognize me :(.
I can't go away without thanking my provisional supervisor here at TAMU, Dr. Susan Pedersen, who actually gets the credit of bringing me here. 


I perceive as this opportunity as a huge milestone in my career progression. I hope I will be able to use this program to gain skills and knowledge in the best possible way that I can. 

Sunday, May 31, 2015

Learning beyond boundaries: Exchanging activity based best lesson plans: A Workshop

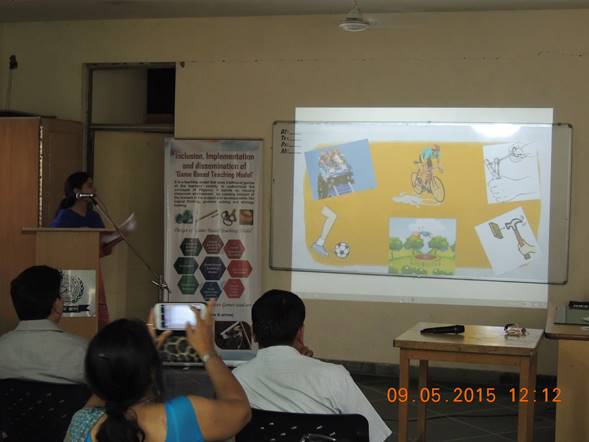
A workshop 'Learning beyond boundaries: Exchanging activity based best lesson plans' was organized as a part of Alumni grant activities of Fulbright Distinguished Awards in Teaching Program Scholar (India to the USA - 2012) S C Joshi, Head Learning Resource Center and Department of Physics, AIS in Ahlcon International School on 9th may 2015. This workshop was exclusively organized for teachers teaching at middle and high school levels (IX – XII) in East Delhi and NCR to share and enforce the best practices of flipping classrooms through various means at K-12 level.

                             Focus Areas of the Workshop were:

  • To work closely with the educational leaders and academics from local schools to help them in developing instructional techniques of flipping classrooms using games into their teaching and to educate them more about use of traditional games as teaching tools in classrooms,

  • Exploring new ways of flipping classrooms in Indian context, judicious use of technology for flipping classrooms, exchanging ideas on flipping instructions using games and toys and on developing activity based course material for high school students and studying efficacy of technological tools in flipping classrooms at K-12 level,

  • To organize an event where teachers from my school and from neighbouring schools (around Delhi and NCR) will get an opportunity to work together as a team and get an exposure through presenting opportunities in the workshop,

  • To exchange ideas on developing activities using games and toys and to collect their responses on the same through direct exchanges,

  • To develop activity based course material for Indian middle and high school students particularly from economical weaker sections,

  • To share the outcomes of 2013 Alumni grant activities and latest developments in implementing games in teaching,

  • Disseminating my project work done during DAT grant to the students and teachers especially from underserved population,

  • Studying efficacy of traditional games and models as low cost pedagogical tools in designing project based science curriculum,

  • Exploring new ways of using games in science teaching and future possibilities of disseminating ‘Game Based Teaching Model.’

  •                   Teachers from thirty two schools were invited to participate in this event from which nine presentations were made by the teachers from AIS and other schools using online technological tools and other game based tools. Here, it is noteworthy that the presentations were supported by technological and game tools and consisted a lesson plan based on the topics covered in the academic curriculum of the schools. 

    The distinctiveness of the workshop lied in the fact that teachers used new, different and creative online technological tools such as toondoo, powtoon, popplet and prezi to put forth their presentations and also incorporated several hands-on –activities using low cost teaching aids that proved to be effective pedagogical means. The chief guest of the day was Dr. Suraj Prakash (Director, Bal Bharti Public School Training Center, Pitampura, Delhi), an eminent educationist and a national awardee for his immense creative contributions to the field of physics and education. Two students from the host school also presented lesson plans on the topic of evolution and digestion using the tech tools of popplet and toondoo.

     The workshop concluded with the learned words from the principal Mr. Ashok .K. Pandey inspiring the teachers to excel in their respective fields. Ms. Sangital Maliwal, Vice-Principal, AIS and Mr. Puneet Duggal, Incharge Senior School, AIS were also present in the workshop. In totality, the event turned out to be quite successful and the participants took along with them unfathomable knowledge and immeasurable confidence in using today’s tech tools to educate the digital natives of tomorrow.


    I am grateful to Mr. Ashok k Pandey, Principal, Ahlcon International School for his constant guidance during planning & execution and consistent support for hosting this activity in the School without which it wouldn't have been possible to organize this workshop. Financial assistance (Fulbright Alumni Grant) from Department of State, United States is deeply acknowledged.